Copyright © Panorama Group 1991 - 2024

As part of the development of the state information system , the specialists of KB "Panorama" adjusted the functionality of its mobile application in terms of informing beekeepers about the cultivation of land with plant protection products.
A serious problem for agriculture is the death of bees, which occurs, among other things, due to poisoning of insects with agrochemicals. But the effective commercial production of agricultural crops without the use of modern preparations for the protection against weeds and pests is not possible. Nevertheless, there are ways to find a golden mean - when the use of modern solutions in the field of plant protection does not go to the detriment of beekeeping.
Through a mobile application, plant growers registered in the system are provided with access to geospatial data on agricultural land and the ability to enter information about planned treatments with plant protection products (PPP). This information includes the name of the PPP from a single reference book in accordance with the State Catalog of Pesticides and Agrochemicals permitted for use on the territory of the Russian Federation, the date of start and end of processing, the method of application: ground or from the air.
For beekeepers, the tools are provided allowing independently to indicate on the map the current locations of nomadic apiaries, as well as their descriptions, including the name of the apiary, the number of the veterinary passport, the date of installation and the number of bee colonies. The beekeeper can indicate the position of the apiary both directly on the map and automatically with use of the built-in navigation system of the mobile device.
Based on the information received from growers and beekeepers, a special hazard map for bees is automatically updated several times a day. The green color on the map shows the contours of fields not affected by PPP processing and apiaries that are not threatened by the use of chemicals. By yellow color the fields and apiaries are shown for which PPP processing is expected within the next one to three days. Red colour of a field and an apiary means that processing of fields by pesticides and to herbicides is doing in current date, and there is also a restriction on the flying of bees.
Determining whether an apiary enters the zone of application of plant protection products is carried out taking into account the radius of bee flight. The time of restriction of bees flying is calculated depending on the hazard class for bees of the active ingredient of the PPP. So for the first class of danger, the restriction of flying is recommended within six days after date of processing. The second class implies a restriction for three days after the application of the PPP. Restrictions for the third class is only on the day of application of chemicals.
In addition to access to the thematic map of dangers, the beekeeper receives push-notifications about the planned introduction of PPP with indication of the active substance, apiary and the recommended time for limiting the flying of bees on the mobile device.
On our website other news on development of the Regional geoinformation system of the Ryazan region have been published also:
- In the Ryazan region, bees are protected with use of geoinformation technologies;
- GIS WebServer AGRO is presented at the webinar "Software and services in agro-industrial complex;
- Governor of the Ryazan region has highly appreciated development of Regional geoinformation system;
- RGIS of the Ryazan region is used in the state cadastral assessment;


In KB "Panorama" the has been developed. The new version has improved tools for using the functions of video analytics when processing data from remote video cameras, processing events by means of Python scripts, searching and selecting objects on the map, designing maps using an inset inside an arbitrary contour, topology control, importing SXF and S57 data with ER update profile support.
In the task , the ability to assign Python scripts for processing events received from remote video cameras connected to the Internet has been added. The assigned scripts are started onto execution automatically when the corresponding notifications about the occurrence of events are received from the video camera. Events include: movement of people, cars and other objects in the video camera's visibility field, crossing the perimeter of a closed zone, appearance or disappearance of objects in the frame, detection of facts of vandalism and sabotage. To receive event notifications, the camera must support appropriate video analytics and the ONVIF standard for Internet communication. The user can select the types of events that interest him and assign scripts to them for processing in the dialog, which is called in the mode of the "Share your photos with the coordinates of the shooting" task. The dialog displays a list of event types supported by a particular video camera. To assign a script, the user needs to select one or more events from the list and click the «Assign/Edit Script» button. After entering the script parameters (its name, path to the script file, called function and arguments), you need to apply the settings. After that, the script will be automatically run every time the corresponding notifications are received from the video camera. Due to the fact that the Python programming language has a large set of plug-ins, the user gets an easy-to-use and extensive functionality toolkit (including mathematical calculations, processing text and graphic data, working with the network, databases, and more). Python scripts can perform a wide range of tasks, for example, saving information about video analytics events into a user database, receiving and saving a snapshot from a video camera when an event occurs, sending event notifications by email. Examples of Python scripts with a description of their purpose and order of calling are given in the corresponding section.
The task "Highlight any area" has been improved. Changing the conditions for selecting objects selected by area has been simplified. The selection of objects by area is performed using the "Select inside the object" and "Select by any area" modes (polygon, rectangular fragment, lasso). At the end of drawing the area on the map, objects located inside the selected area are highlighted. To change the selection conditions, press the right mouse button and select one of the modes in the context menu: Highlight inside (delete intersection), Highlight with intersection (and inside), Highlight outside (delete intersection).
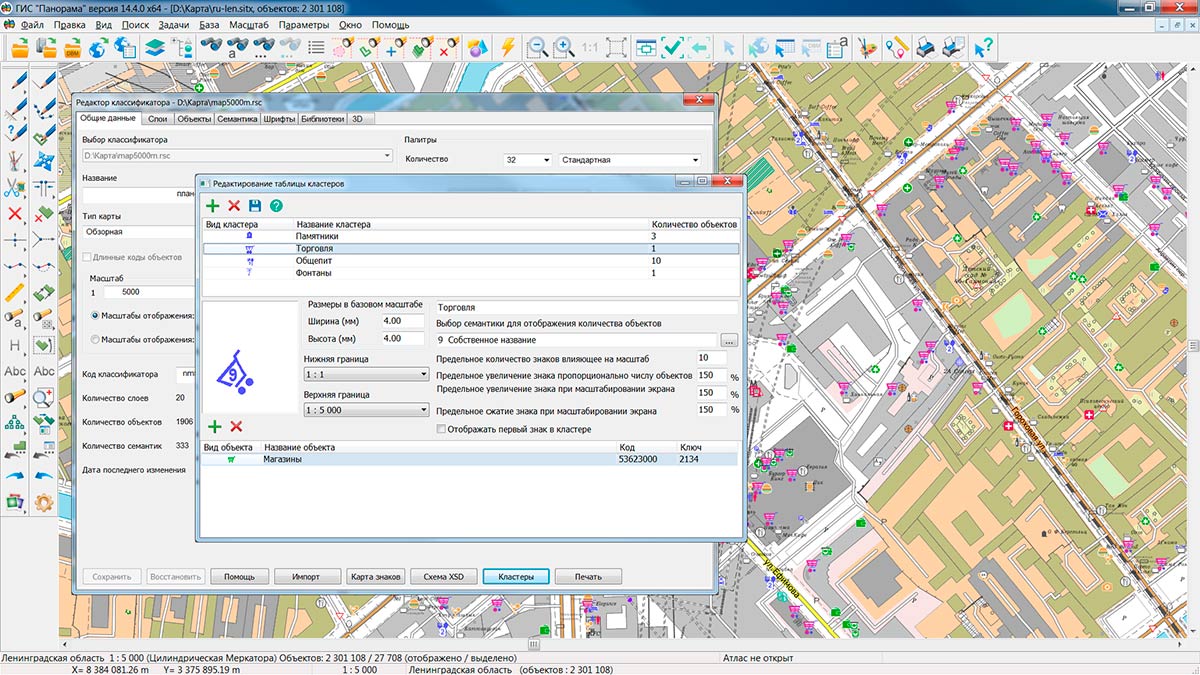
has been improved. If clusters are displayed on the map (generalized signs of closely spaced objects specified in the classifier), then the corresponding signs of clusters are displayed and marked, taking into account the number of signs and their location on the map.
The display of objects of the type, implemented in the library of programmable signs shape.iml64, has been improved. The new algorithm allows cutting the map image according to the metric of polygons and multipolygons of arbitrary shape. Objects of type "Map inset" contain a link to the map file in the service semantics "Graphic file or map" (32769). Cutting the map image is performed according to the metric of the "Map Inset" object. Examples of objects of the "Map inset" type are contained in the map included in the GIS Panorama: File - Example data - C:\Users\Public\Documents\Panorama\Panorama14\data\shape\shape.sitx.
The has been improved: when performing the control of self-intersections, a correction of adjunction of the points of the linear object's contour to its own contour has been added. When performing control in the "Edit" mode, the contour is cut into two or more separate objects.
The task has been improved. "Create a set of maps" mode has been added into the dialog, which is designed for automatic processing of a set of selected data and creating a separate user map for each DXF file. As a result of the task execution, the list of generated maps is saved into the MPT project.
When importing S57 sea maps, support has been added for datasets with updates of sea maps (ER profile), which are located in files with extensions 001, 002, 003, and so on. The update files must be placed with the source data set with extension 000 in the same folder or according to the folder structure according to standards. The names of the source dataset and update files must match.
The new version of the program is available for download in the section.


In KB "Panorama" the version 14.4.0 has been developed for creating GIS applications. The GIS ToolKit consists of a set of visual components (supplied in source code) and API functions of the GIS core for direct access to spatial data. The toolkit is designed to develop client-server and desktop 32-bit and 64-bit applications that require processing and visualization of spatial data.
The new version allows you to import sea maps of the S57 standard in update mode (ER profile). Maps for updating are located in files with extensions 001, 002, 003, and so on, and must be placed together with the source data set with extension 000 in the same folder or in accordance with the folders structure according to S57/S63 standards. The names of the source dataset and updates files must coincide.
Possibilities for display of titles have been expanded. New properties of design the titles allow to mark the title by a shade, outline, a background and a frame, and also to format the text taking into account a spacing sign (an insert of spaces) and the chosen register (uppercase, lowercase, as in a sentence). There is added the ability to change the thickness of solid and dashed contours of objects by the value of the service semantics "Line thickness in mm" (31005).
For automatic control of entered values of character semantics in "Classifier Editor" the possibility has been added for assigning to one semantics at once the several templates of a string defining the valid characters in value of a string or the sample of a string of a special purpose, for example, GUID, cadastral number and others. For strings that have value templates, when you enter a value in the "Select Object" dialog, it checks if it matches one of the specified templates. If there is a mismatch, the message indicates to the user the character number from which the input string does not match the template.
Display of rasters with smoothing has been added. When the raster image is enlarged by more than 2 times from the original size in pixels, smoothing is performed. The new algorithm of display allows to get rid of "pixelization" effect when you increase the rasters. Image smoothing is performed by bicubic interpolation method (by 16 nearest raster elements).
The task "Import of raster data" has been improved. There is added a use of ZRS placing files from Zulu for automatic positioning of imported rasters. In dialog "Import of raster data" for an automatic binding of the raster image in the work region the binding's files the WORLD FILE, TAB (MapInfo) and MAP (OziExplorer) are also supported. To use a binding file when importing rasters, in the dialog it is enough to select the type of binding file or the name of the product that generated the file from the list.
The algorithm of data compression of a matrix of heights has been improved. Functions of optimisation of a matrix of heights were improved - compression of 16-bit data has been added. To compress previously loaded 16-bit matrixes, select the "Optimization of packed matrixes" mode in the dialog. Typically, a compressed matrix occupies a volume 5-7 times less than the original volume and contains 3-4 overview matrixes (reduced copies). Reducing the volume and using reduced copies greatly accelerates the visualization of the matrix.
Support of XML files having the size more than 4 GB has been added. Processing of XML format is used when importing GML data, reading cadastral data from XML format files, and in other tasks.
The new version of the program is available for download on the page.


In KB "Panorama" the for Qt Designer SE version 14.2.1 has been developed. In the new version a support of API in Python language for developing GIS-applications has been implemented, the composition of demo examples has been expanded by GIS-applications for working with scripts and displaying a 3D-model of spatial data. A creation of arbitrary user attributes of objects of digital maps, the description of which is not contained in the classifier has been added. The supported size of data of XML format (more than 4 Gbytes) for MAPAPI interface functions has been increased.
API in Python language is included into GIS Constructor that provides access to several thousand functions of the MAPAPI-interface for spatial data analysis, automation of processes of creating and updating digital terrain models. There are several options for using scripts as part of a GIS application: a visual component of designing, a program interface of a call from the C/C++ language, direct writing and execution of Python scripts. Due to the fact that the Python scripting programming language has a large set of connected modules, the user receives an easy-to-use and extensive auxiliary toolkit (mathematical calculations, processing of text and graphic data, work with a network and another) when creating a GIS application.
To run Python scripts from dialogs, a visual component of designing and an example of its use have been added into the GIS Constructor. The dialog is designed for user-friendly maintenance of a set of scripts to be run: the list of executable files is organized in the form of a tree, the user can create his own themes and fill them with the necessary set of scripts, creation of a new script and its editing can be done directly from the dialog. The source code of the visual design component is included into the GIS Constructor. GIS application developer can use it as a basis for developing their own specialised solution.
MAPAPI-interface functions can be used directly from the Python environment. Prototypes of functions are declared in the form of imported Python scripts. The function called from the script performs some autonomous action or uses the selected objects on the map.
To enter additional data processing parameters, dialogs written on the basis of a standard Tkinter component can be called. The GIS Constructor includes a basic set of scripts for demonstrating the execution of various procedures for processing coordinates and attributes of objects of a vector map, solution of computational tasks, converting of data and other tasks. An example of using the MAPAPI-interface functions from the Python environment is included in the GIS Constructor.
The list of examples has been expanded with a GIS application that demonstrates the display of a 3D model of spatial data. The example implements a moving, turn, scaling and movement along an arbitrary trajectory specified by the user. This application can be taken as a basis for embedding functionality of 3D modeling.
Possibilities of applying user semantics have been expanded for recording arbitrary object properties which are not described in the list of semantics of RSC classifier. User semantics are created when importing vector data (SHP, KML, MIF and others), when the field names (keys) of object attributes are not found in the selected RSC classifier. To support such semantics, temporary semantics are created in the RSC classifier in the range of codes 660000 and higher for the duration of a GIS session. Semantics name is filled by name of fields in the source vector data. When simultaneous opening several maps with one classifier, the list of temporary semantics will be supplemented with user semantics from all maps. When opening different combinations of maps, temporary codes in different sessions may have different values. When exporting vector maps to SXF and TXF files, user semantics is written with code 32862 and data record of the form "field_name:value". When imported, such semantics are transfered back into temporary semantics with the addition of new code to RSC. On the map, semantics are written with codes in the range from 60000 and above. The correspondence between the semantics code on the map and the field name is stored in the map metadata. When opening a map by the list of field names of user semantics, temporal semantics are automatically added into RSC.
Support of XML files having the size more than 4 GB has been added. Processing of XML format is used in a wide range of tasks in the development of GIS applications (for example, importing data in GML format).
GIS Constructor is a set of geoinformation components for use in the visual programming environment of Qt Designer, which allows you to develop your own GIS applications. The visualization of the contents of digital maps is made in conventional symbols adopted for topographic, geographical and various special maps. Geoinformation system has ample opportunities for performing calculations, for providing display of spatial data on various graphic devices in standard and user systems of conventional symbols. The main functions can be executed in multithreaded mode. It supports automatic optimization of used memory for processing large amounts of data (tens of gigabytes) on limited resources (hundreds of megabytes).
The toolkit is adapted for work on a wide range of operating systems (Astra Linux SE, ALT Linux, Elbrus, Ubuntu, CentOS, QNX) and architectures (Intel, Elbrus, PowerPC, SPARC, ARM). The toolkit includes components of visual designing the GIS applications and library of a multiplatform multithreaded GIS core. GIS Constructor provides a cross-platform MAPAPI interface that allows a programmer to implement development in an operating system convenient for it. The developer can release GIS applications for a set of operating systems by simple assembly with minimal changes to the program source code.
The new version of the program is available for download in the section.


In KB "Panorama" the digital geographic map of scale 1: 1 000 000 in SITZ format onto territory of the Republic of Croatia has been prepared. As a source for preparation of the map the obtained from the information from the site has served. The map contain information on the number of inhabitants for cities and the name of settlements in Russian. As additional materials the World map of scale 1: 5 000 000 and data were used.
The map was led to the classifier of geographic maps of scale 1: 1 000 000 (1mogk13g.rsc). It can be used for a general assessment of the area and the study of natural conditions, to ensure the educational process, as a basis for the creation of geographic maps of a smaller scale, thematic and special maps, and solving other tasks. The map is distributed free of charge under a free .
Digital geographic maps of scale 1: 1 000 000 in SITZ format are available for download on the page "Digital maps".


Ph.: +7 (495) 739-0245, +7 (925) 221-1603
www.gisinfo.ru | panorama@gisinfo.ru
105005, Russia, Moscow, Baumanskaya Street 7, building 1, office 229 (m. Baumanskaya)
Copyright © Panorama Group 1991 - 2024


 Mobile version
 Full version