Copyright © Panorama Group 1991 - 2024

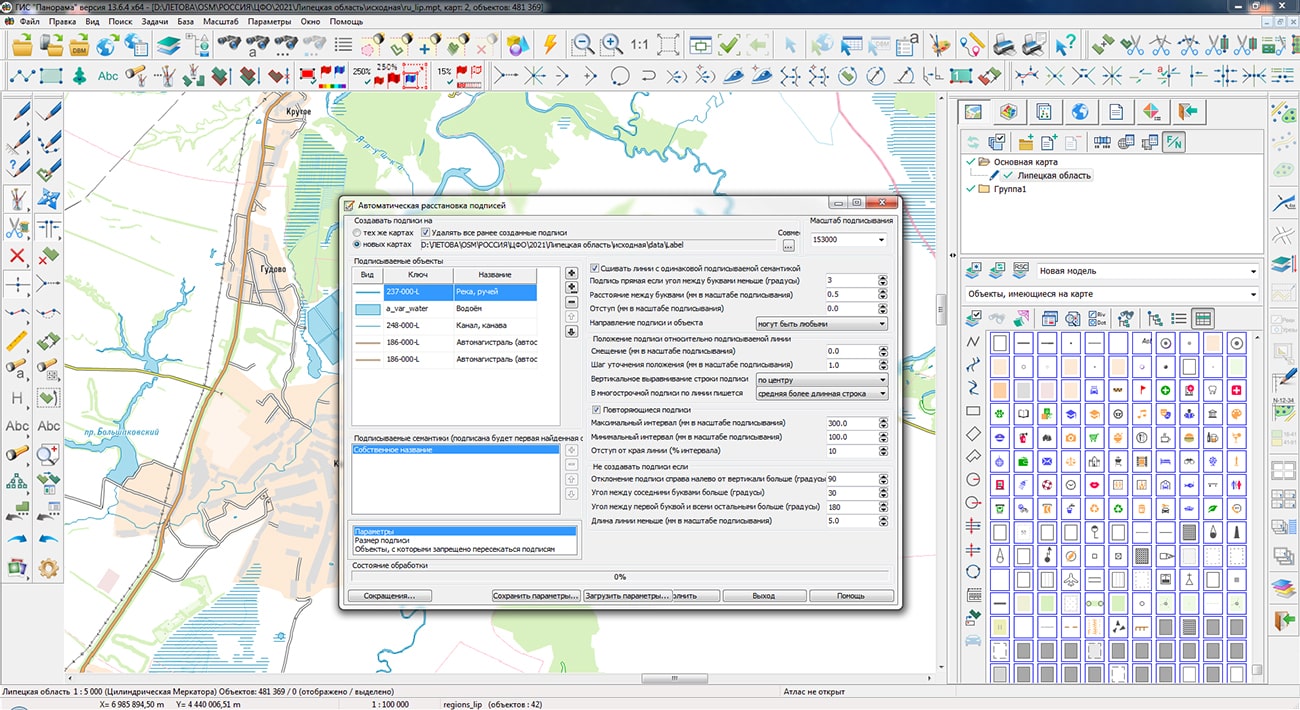
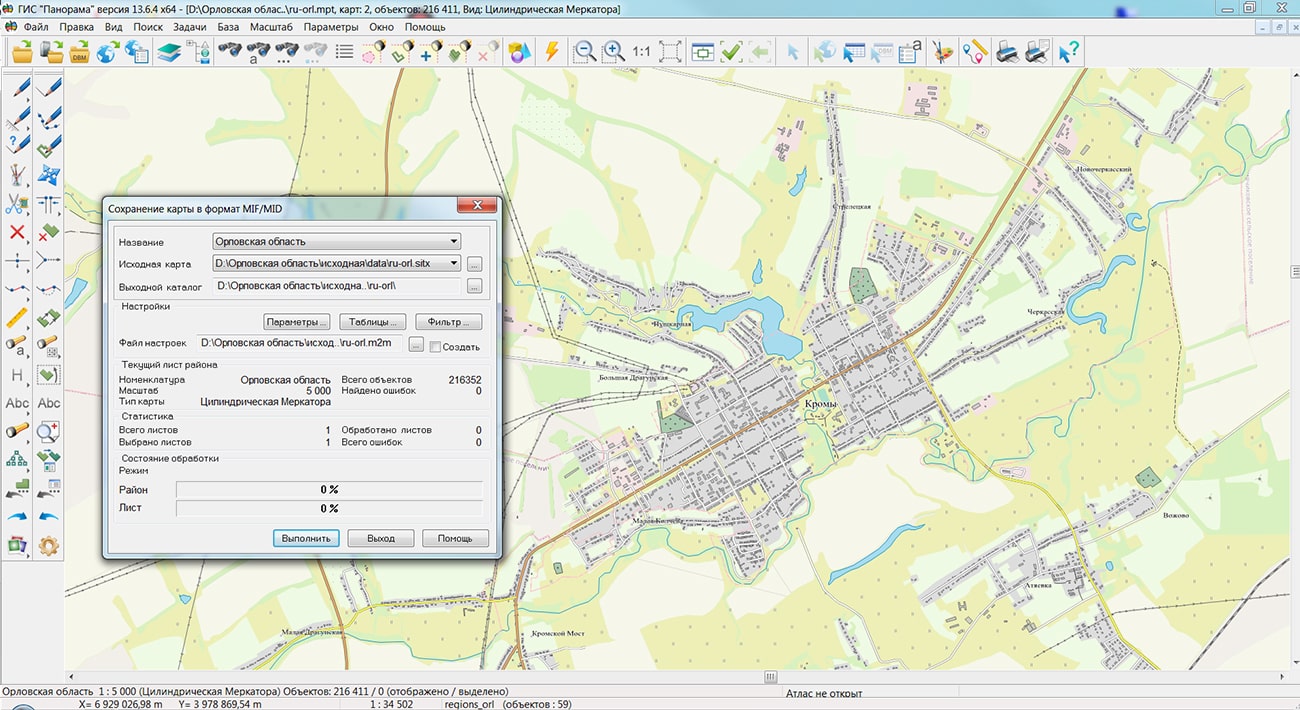
Specialists of KB "Panorama" prepared and placed on the geoportal the maps of the Lipetsk and Oryol regions. The maps were formed using OpenStreetMap data, source data was obtained from website. To work with the maps, you can use the program or other software products of KB "Panorama".
The maps were led to the modernised classifier of large-scale plans of scale 1: 5 000 (map5000m.rsc) and were saved into a packed project (MPTZ). The MPTZ format project includes a digital map of the region's territory (country, subject of the federation, administrative region), a map of the administrative-territorial division of the region and a digital classifier. Publishing of updates in bank of spatial data is made by using the program of . Publishing contents of bank of spatial data on the geoportal and data access for downloading are implemented by means of .
Free maps on the basis of OpenStreetMap data are available for download on the page "Digital maps".


Specialists of KB "Panorama" have prepared a video lesson on exporting territorial planning data in GML format for subsequent transmission to the FSIS TP portal. Users of the , or can form documents of territorial planning of municipalities using a complex of urban planning tasks.
The training material demonstrates features of data preparation, filling of the mandatory characteristics and formation of GML files in accordance with the Order of the Ministry of Economic Development of the Russian Federation dated 01/09/2018 № 10. On the basis of this order in software products of KB "Panorama" the classifier of conventional symbols terrplan.v5.rsc has been developed. The classifier implements a general list of layers, objects and attributive characteristics of objects of territorial planning and urban planning activities.
The task "Exporting a map of territorial planning documents into GML format" provides reading of map objects and their unloading into a file of GML format. Maps of territorial planning documents are made in accordance with the level of management: schemes of territorial planning the Russian Federation, scheme of territorial planning the subject of the Russian Federation, scheme of territorial planning a municipal district, a general plan of an urban district and a general plan of an urban settlement.
You can get acquainted with the training materials in the "Video lessons" section.


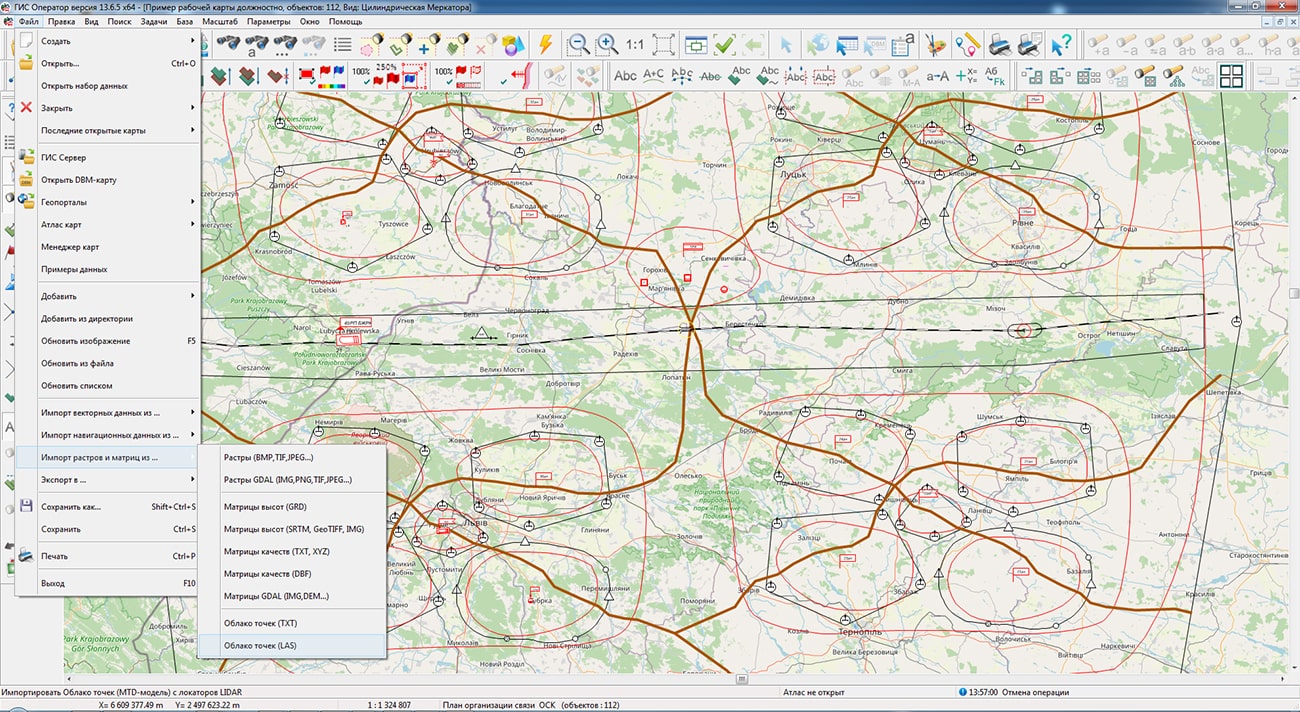
In KB "Panorama" the version 13.6.5 has been developed. In the new version the "Loading of MTD-model from LAS-file" has been accelerated. The task performs formation of MTD models from LAS files obtained using LIDAR laser locators. Data of LAS-files can contain results of sounding the earth or sea surface, atmosphere. The MTD model contains point measurements sorted block-by-block, which provides quick access to data for solving computational and analytical problems. The new method of block filling the MTD model reduces the loading time of LAS files larger than 8 GB by 3-5 times. Loading of control LAS file with number of points of 555 million in volume of 14.4 Gbytes is executed for 16 minutes.
Possibility to group mathematical formulas for a combination of mathematical expressions and logic conditions has been added by searching and selecting objects on a map. For example, in the presence of semantics with the amount of saltpeter in tons applied to a given area, and semantics with the class of soil fertility, it is necessary to select areas where the amount of nitrogen per hectare is optimal. Let semantics 123 contain the amount of saltpeter applied to the area in tons, and semantics 345 contain the soil fertility class (from 1 to 6). Since the area of the plot (S) is calculated in square meters, and ammonium nitrate contains 34.5% of nitrogen, the formula for calculating the specific dose of nitrogen will look like: "#123*1000*0.345/ (S/10000)" or simplified "#123*3450000/S". For the first class of fertility, we set the first group of formulas: "#345" with boundary values 1 and 1 and "#123*3450000/S" with boundary values 40 and 50, for the second class the boundary values of the first formula are 2 and 2, the second 45 and 55 and so on. Within the group, select the logical "AND" condition - both formulas must meet the boundary conditions. We select the logical "OR" condition between the groups - although in one group the conditions must be fulfilled during the calculation. When you press the "Select" button, all areas where the nitrogen dose is optimal will be highlighted. The typed conditions can be saved in templates of search conditions under the specified names and applied as necessary.
The task of connecting geoportals has been improved. Support for layers from the Rosreestr geoportal has been added: Cadastral okrug, Cadastral districts, Cadastral quarters, Land plots, Land plots put up for auction, Red lines, Unified real estate complexes. Geoportal provides data in vector tile form in pbf (Protocolbuffer Binary Format) format. The data contains the coordinates of objects, signatures of plots, semantic characteristics. The parameters of connection to geoportals, stored in the wmslist_ru.xml file, have been updated.
The new version of the program is available for download in the section.


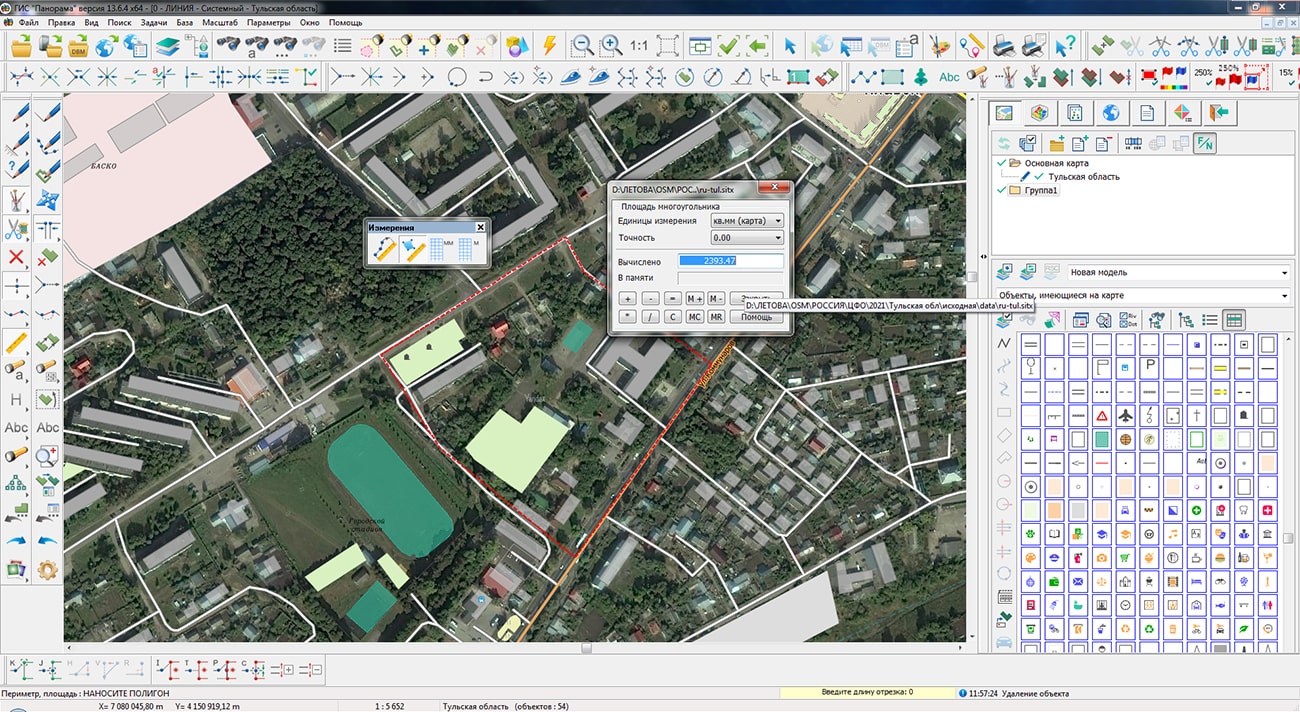
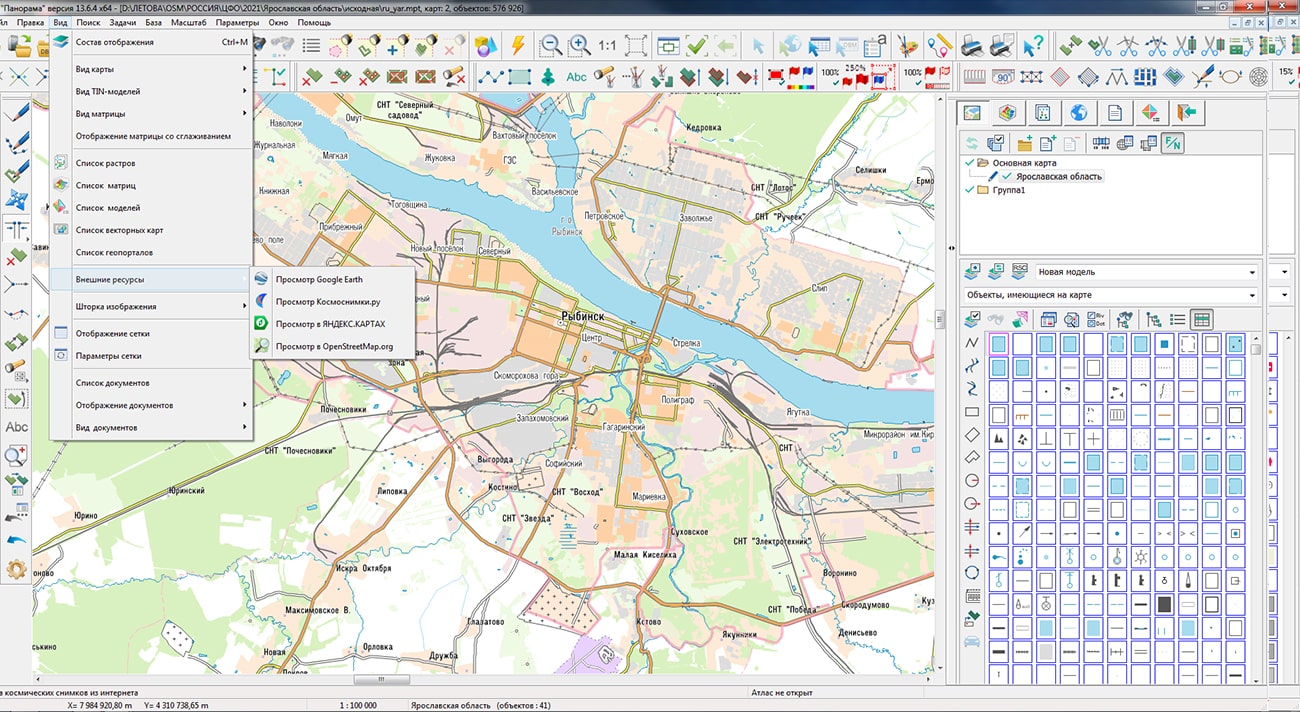
Specialists of KB "Panorama" prepared and placed on the geoportal the maps of the Tula and Yaroslavl regions. The maps were formed using OpenStreetMap data, source data was obtained from website. To work with the maps, you can use the program or other software products of KB "Panorama".
The maps were led to the modernised classifier of large-scale plans of scale 1: 5 000 (map5000m.rsc) and were saved into a packed project (MPTZ). The MPTZ format project includes a digital map of the region's territory (country, subject of the federation, administrative region), a map of the administrative-territorial division of the region and a digital classifier. Publishing of updates in bank of spatial data is made by using the program of . Publishing contents of bank of spatial data on the geoportal and data access for downloading are implemented by means of .
Free maps on the basis of OpenStreetMap data are available for download on the page "Digital maps".


In KB "Panorama" the version 13.3.1 has been developed for creation of GIS-applications in the environment of C ++ Builder, Delphi Embarcadero. In the new version there is expanded the use of mathematical expressions (formulas), including various mathematical operations on the values of the object semantics and its measuring properties when searching and editing objects. A bookmark for entering a list of mathematical formulas and a range of values that the calculation result must correspond to has been added into the "Object Search" dialog. In the "Object Search" dialog (TMapFind component), a bookmark has been added for entering a list of mathematical formulas and a range of values to which the calculation result must correspond. When searching for objects, you can set the criteria for selecting objects based on the correspondence of calculations to the specified ranges of values for one of the formulas or all at once.
For example, it is necessary to find regions with a low class of population density per square kilometer. Map objects (regions) can have the semantics "Population density class" (code - 101, is filled not in all objects) and "Population size" (code - 102, is filled in all objects, measured in thousands) living in a given region. "Population density class" can take values from 1 to 3 (low, medium, high). The low class corresponds to values in the range from 0 to 10. To calculate the population density, it is necessary to divide the population by the area of the territory, taking into account the fact that the area of the region (S) is transmitted in square meters, the population in thousands, the calculation formula will be as follows: "#102 *1000/(S/1000000)" or simplified "#102 *0.001/S".
For the formulas, add the selection criteria that should set the search for objects either with a low density class, or with a calculated low population density, for which we will form a list of formulas: "#101" with boundary values from 1 to 1 for the population density class; "#102 *0.001/S" with boundary values from 0 to 10. To search by two formulas, select the logical condition "OR" - at least one of formulas should correspond to boundary conditions. Pressing the Select button will highlight all regions with a low population density class. The typed conditions can be saved in templates of search conditions under the specified names and reapplied.
The dialog for connecting geoportals has been improved (component TMapWMSPopupDialog) - there is added a support for layers from the Rosreestr geoportal: Cadastral districts, Cadastral areas, Cadastral quarters, Land plots, Land plots put up for auction, Red lines, Unified real estate complexes. Geoportal provides data in vector tile form in pbf (Protocolbuffer Binary Format) format. The data contains the coordinates of objects, signatures of sites, semantic characteristics. The parameters of connection to geoportals, stored in the wmslist_ru.xml file, have been updated.
The dialog "Open data from GIS Server" (TMapGisServer component) has been improved. For users who have the right to view the state of the operation in the "Monitoring" tab, the ability to save the log (protocol) of the server operation into a text file for further analysis or sending to the technical support service has been added.
The GIS ToolKit consists of a set of visual components (supplied in source code) and API functions of the GIS core for direct access to spatial data. The toolkit is intended for the development of client-server and desktop 32-bit and 64-bit applications that require processing and visualization of spatial data. Spatial data can be located both at the workplace (direct access to data) and in a local network or the Internet (components of access to the GIS Server or data exchange using international protocols are used).
The new version of the program is available for download on the page.


Ph.: +7 (495) 739-0245, +7 (925) 221-1603
www.gisinfo.ru | panorama@gisinfo.ru
105005, Russia, Moscow, Baumanskaya Street 7, building 1, office 229 (m. Baumanskaya)
Copyright © Panorama Group 1991 - 2024


 Mobile version
 Full version