Copyright © Panorama Group 1991 - 2024

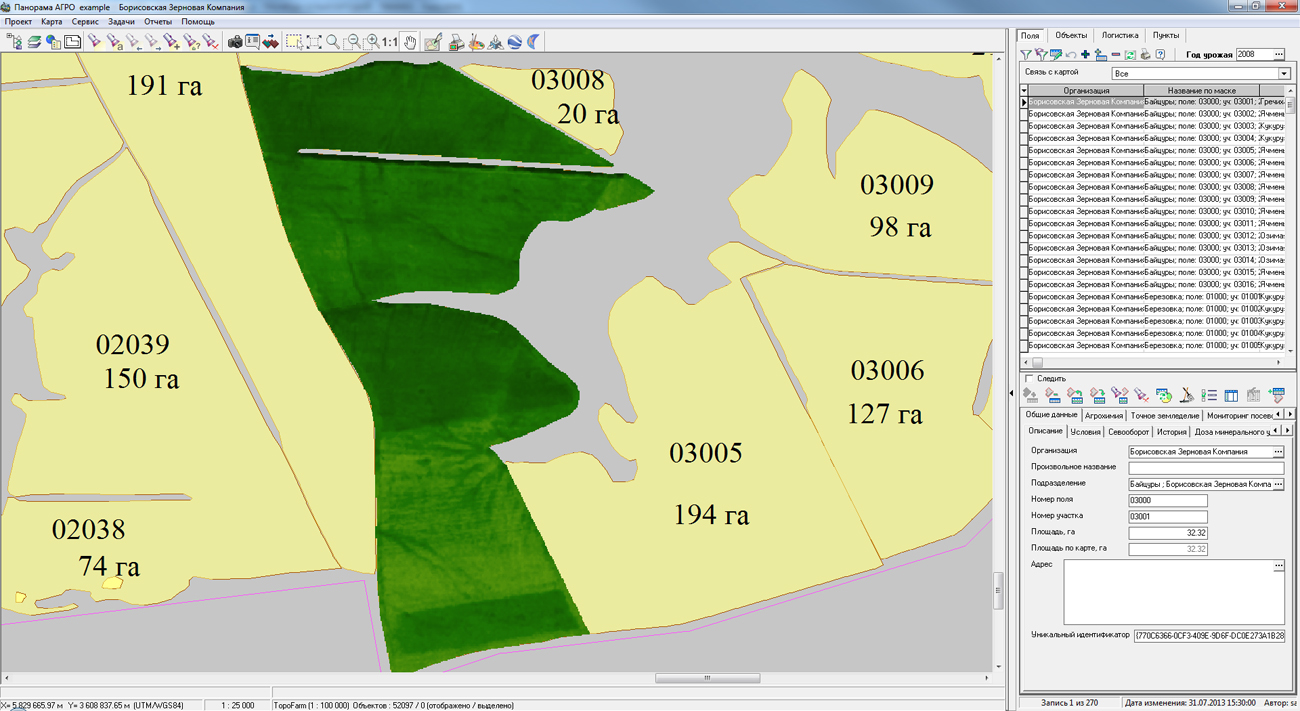
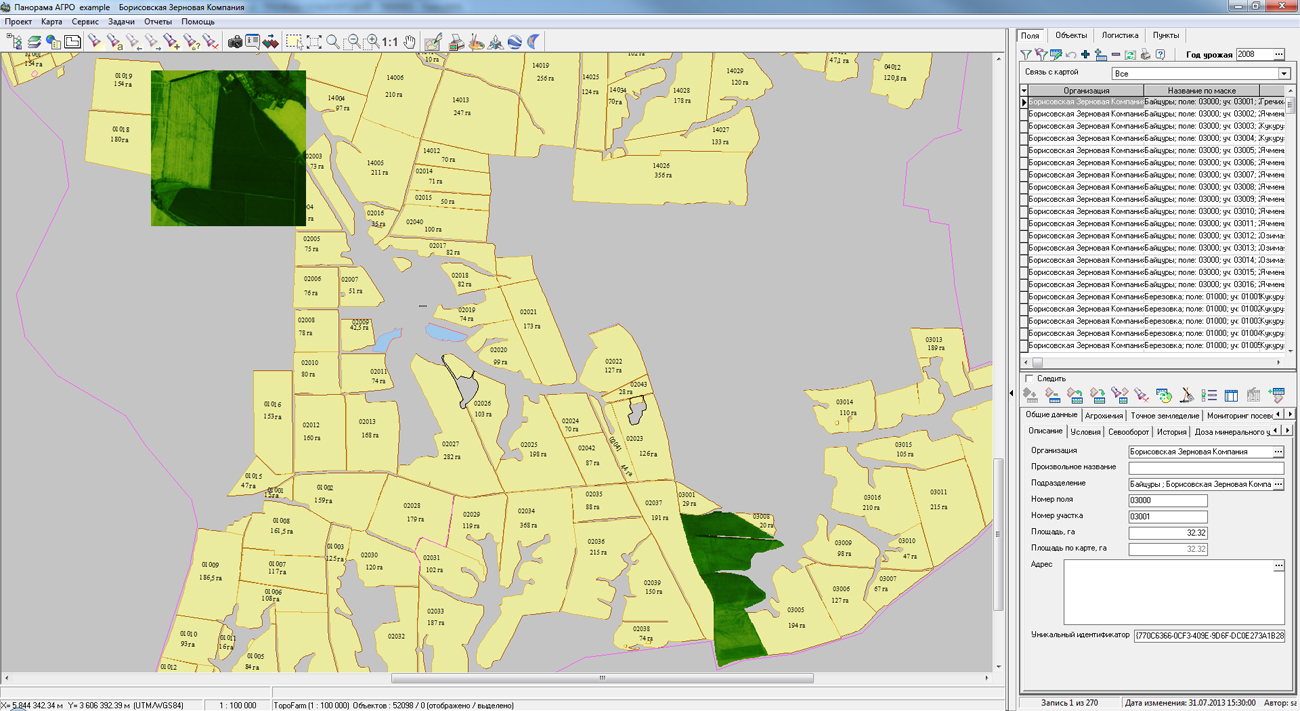
In KB "Panorama" the version 5.0 is developed, which supports viewing the matrixes of vegetation indices obtained as a result of satellite monitoring.
Numerical values of vegetation indexes are calculated by external service of satellite monitoring. The result is provided in the form of a matrix of qualities with a discreteness corresponding to the resolution of the original image. Data of satellite monitoring are provided by the Geosys company.
The new version of "Panorama AGRO" supports a viewing and analysis of the matrixes of vegetation indices of the following types: Normalized Difference Vegetation Index (NDVI), Chlorophyll Vegetation Index (CVI), Enhanced Vegetation Index (EVI), Green Normalized Difference Vegetation Index (GNDVI). The most popular in agriculture is the index NDVI (Normalized Difference Vegetation Index) - the normalized relative index of vegetation, according to which it is possible to judge the development of plant biomass during vegetation. According to numerous scientific publications, according to the NDVI index, crop yields can be predicted with high accuracy. The vegetation index NDVI is changed all season and its values are different during the growth, flowering and maturation of plants.
GIS "Panorama AGRO" allows to use full range of data required for technologies of exact agriculture: data of satellite monitoring the crops, soil sampling points, maps of soil fertility, application of GLONASS/GPS tools for monitoring the field progress and yield mapping, preparation for the differentiated application of fertilizers, support of data collection from unmanned aerial vehicles, monitoring of vehicles and agricultural machinery, and others.
Line of agricultural geoinformation products of KB "Panorama" for desktop and WEB clients includes the "Panorama AGRO", , , "Workstation of Agronomist", Panorama AGRO Service and .
Constructed on their base the corporate GIS in a combination with cartographical and professional provides a single geoinformation space for the agro-enterprise.
New versions of the programs are located on our website in the section.


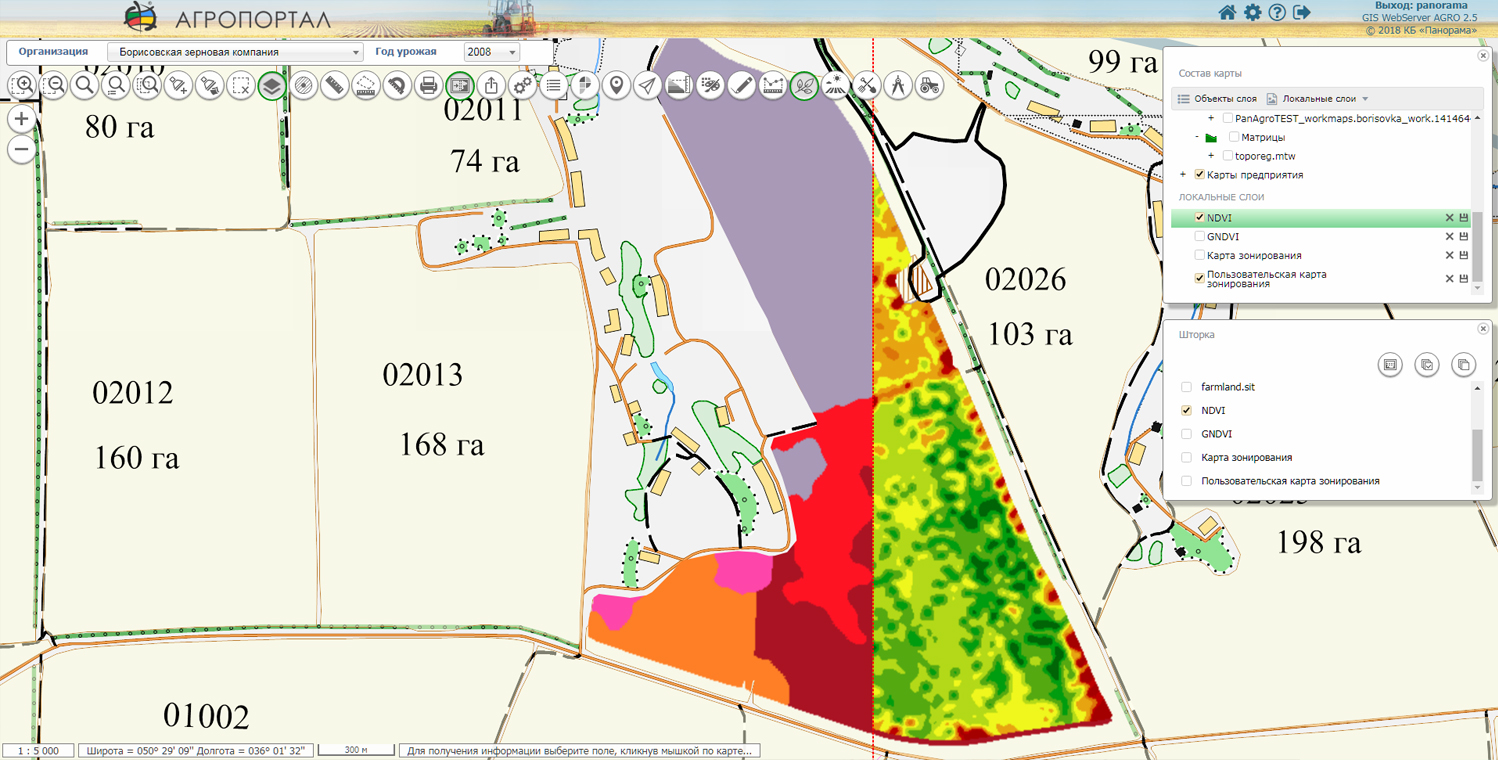
In KB "Panorama" the version 2.5 is developed, in which possibility for the visual analyzing the data of satellite monitoring of agricultural land is added. The new version of the program allows you to view the data of vegetative indices NDVI (Normalized Difference Vegetation Index) and GNDVI (Green Normalized Difference Vegetation Index), characterizing the development of plant biomass during vegetation.
Data of satellite monitoring is loaded from web service of company and is accumulated in information base the with a binding to a field's contour. In GIS WebServer AGRO, the viewing and analysis of vegetation indexes matrixes from a single agricultural enterprise base has been added. For the analysis of numerical values of the vegetation index by matrixes of qualities the tool "Value of matrixes in a point" is intended. Multiplatform cartographical service provides provision of data. Data exchange with the service is performed according to international open standards OGC: WMTS, WMS, WCS and WFS. As a source of data of satellite monitoring (numerical values and images of vegetation indexes) for GIS WebService SE are the maps and the matrixes placed on the GIS Server. Publication of data on the is performed automatically, at the time of loading the satellite monitoring's data, in the time mode close to the real one.
There are supported a retrospective analysis of images of several matrixes of the vegetation indexes characterising development of a biomass of plants at various stages of vegetation, and also a viewing the maps of zoning and graphs of daily average values for several seasons. The zoning maps, built using historical NDVI imagery, allow us to identify problem areas on the map of fields, and accurately predict crop yields.
The new version adds the ability to save the last location for each user of the program, in the map editor, the group operations for deleting and moving map objects are added. Modes of selecting objects of a map are expanded: there are added a selection of objects arbitrarily specified on a map and selection of objects by a conventional symbol of selected object. You can see the example of the working the GIS WebServer AGRO on the page of the demonstration project .
The new version of the program is available on the site in the section.


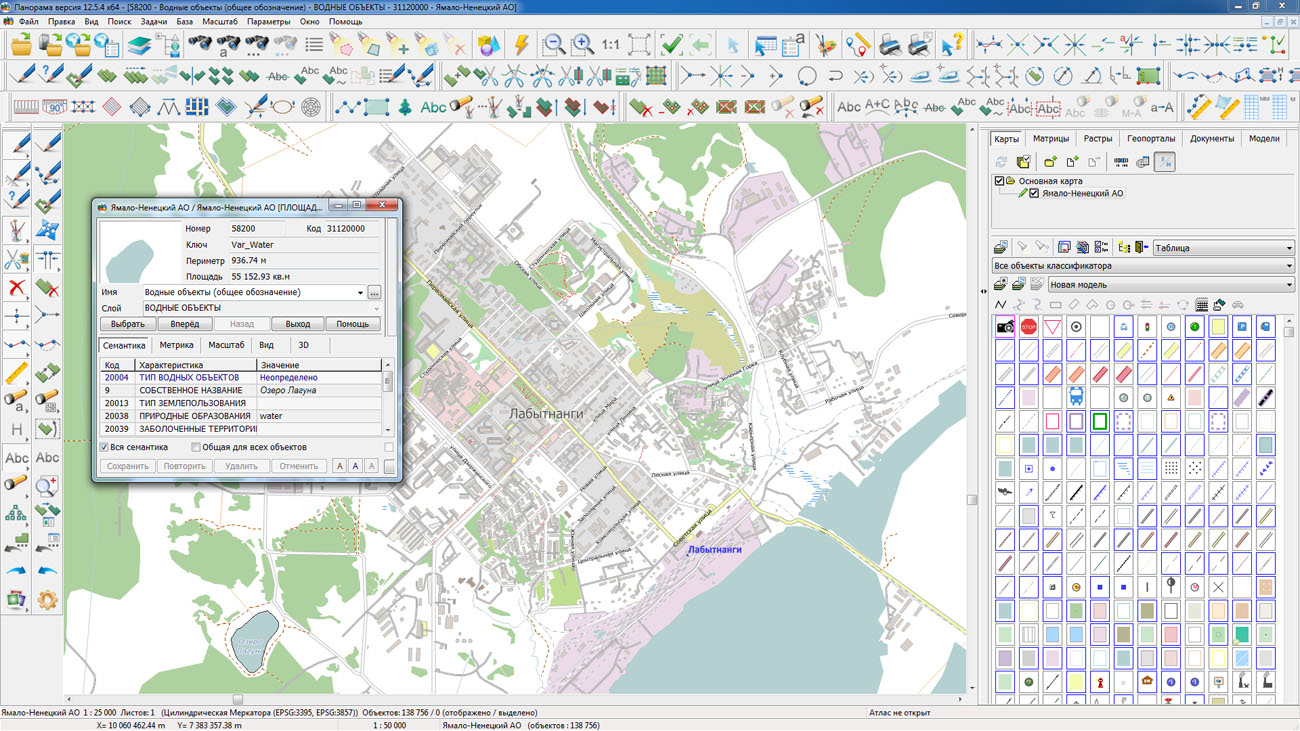
On the geoportal the maps of the Khanty-Mansi Autonomous Okrug and Yamalo-Nenets Autonomous Okrug formed according to OpenStreetMap data, were updated. Source data obtained from the website are complemented by objects from maps of scale 1: 1 000 000. There are added the objects of hydrography, vegetation, road network. For work with the received maps it is possible to use the program of or other software products of KB "Panorama".
Publishing of updates in bank of spatial data is made by using the program of . Publishing contents of bank of spatial data on the geoportal and data access for downloading are implemented by means of GIS WebServer SE.
Free maps on the basis of OpenStreetMap data are available for download on the page "Digital maps and images".


In KB "Panorama" the GIS Constructor for Qt Designer SE version 1 is developed for Windows. GIS Constructor for Windows allows you to develop GIS applications based on the MAPAPI interface, using the capabilities of the Qt framework for Windows. The program includes test cases demonstrating the basic capabilities of processing the digital data: display of digital vector, raster and matrix maps; printing of the displayed data to various output devices; search of objects of vector maps by the specified set of values of objects attributes and their geometrical parameters; creation and editing of vector maps; construction of three-dimensional models of terrain.
The components of the QDMapView map display are included into the graphics components. It can be taken as a basis for developing your own GIS application. Interactive interaction with the map can be realized through predefined event handlers. The functionality of changing the composition of the displayed data and objects, searching and marking, printing and other typical tasks is available through the dialogs and functions of libraries the GIS ToolKit for Windows.
GIS Constructor for Windows consists of components of visual and non-visual designing and kernel's libraries of GIS application from GIS Toolkit composition. Cross-platform of Qt libraries and MAPAPI interface allows you to carry out assemblage of the resulting source texts with help of GIS Constructor for Linux, while maintaining a single code base.
GIS Constructor is a set of geoinformation components for use in the visual programming environment of Qt Designer, which allows you to develop your own GIS applications. The visualization of the contents of digital maps is made in conventional symbols adopted for topographic, geographical and various special maps. Geoinformation system has ample opportunities for performing calculations, for providing display of spatial data on various graphic devices in standard and user systems of conventional symbols. The main functions can be executed in multithreaded mode. It supports automatic optimization of used memory for processing large amounts of data (tens of gigabytes) on limited resources (hundreds of megabytes).
The toolkit is adapted to work on a wide range of platforms and supports operating systems such as Astra Linux SE, MSVS, CRTOS Neutrino, Elbrus, Zarya, Ubuntu, Alt Linux, QNX, CentOS and others. It can be used in computer complexes with processors of architectures ARMv7, Elbrus, PowerPC, Intel x86, Intel x64 and others.
The new version of the program is available for download in the section.


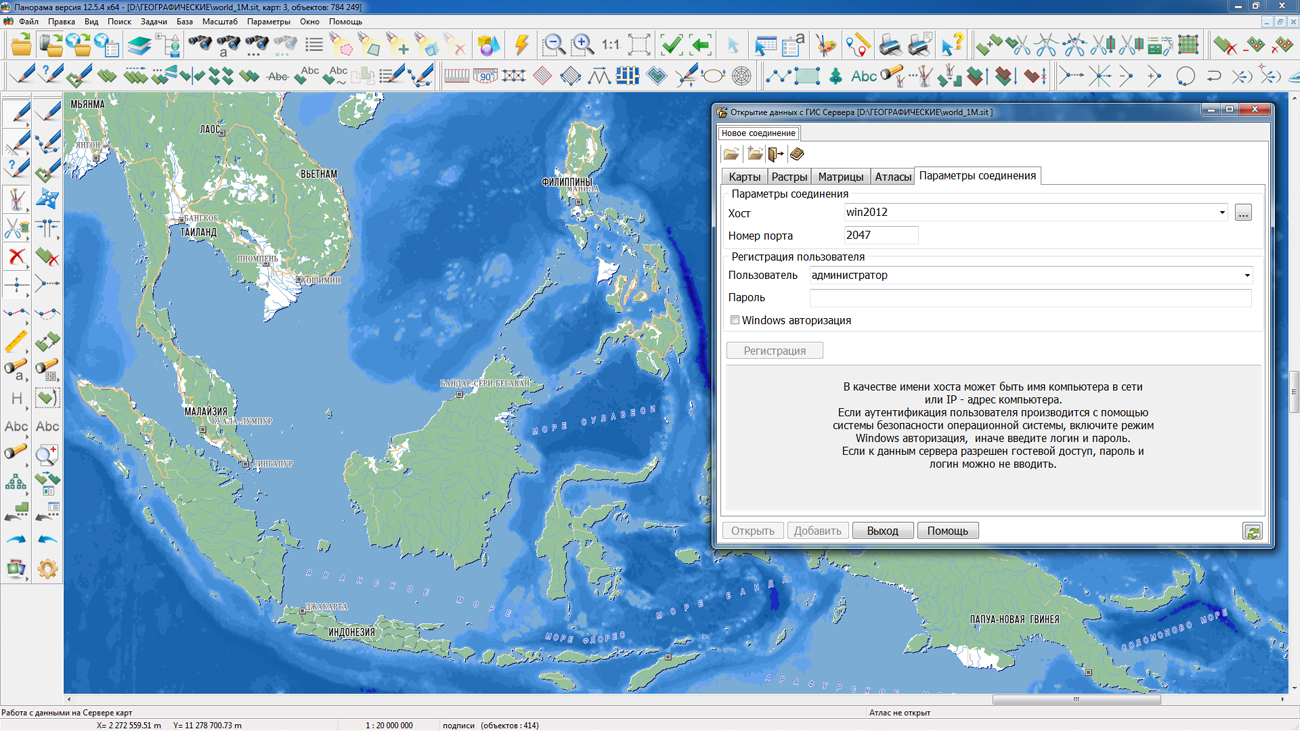
In KB "Panorama" the version 8 is developed. The program provides multi-user remote access to digital vector maps, remote sensing data, matrixes, documents and spatial data bases. GIS Server implements user authorization based on the Kerberos protocol, automatic formштп a tree of available data types for each user, administration of access at the level of virtual folders. The application provides access to spatial databases for viewing and editing in the form of digital maps of the terrain in given conventional symbols, multi-level connection of GIS Servers among themselves with automatic caching of transmitted data, remote monitoring of the operation status, automatic data backup, automatic restart in case of system-wide program failures or hardware, round-the-clock operation without interrupting users during administration of users list and more.
In the new version, the tools for remote administration of the GIS Server on the Web are extended. There is added the ability to configure the GIS Server connection to other servers to gain access to remote data through several connections. Tools of monitoring a status of the server in Web are implemented for viewing the list of active users and open data, remote viewing the program work log.
There is improved the performance of updating vector data on clients with intensive updating of objects on the server (thousands of requests per second). The composition of diagnostic messages is expanded when updating the spatial database. Recording into the protocol of the server work is executed in UTF-8 encoding, the user interface is localized in several languages.
GIS Server is designed to provide remote access to spatial data for users of programs , , and others. The software product is certified in the information security system. GIS Server is used in various federal, regional and corporate projects for managing spatial databases, for organizing the interaction between web clients, desktop and mobile clients and various service departments.
The new version of the program is available for download on the page.


Ph.: +7 (495) 739-0245, +7 (925) 221-1603
www.gisinfo.ru | panorama@gisinfo.ru
105005, Russia, Moscow, Baumanskaya Street 7, building 1, office 229 (m. Baumanskaya)
Copyright © Panorama Group 1991 - 2024


 Mobile version
 Full version